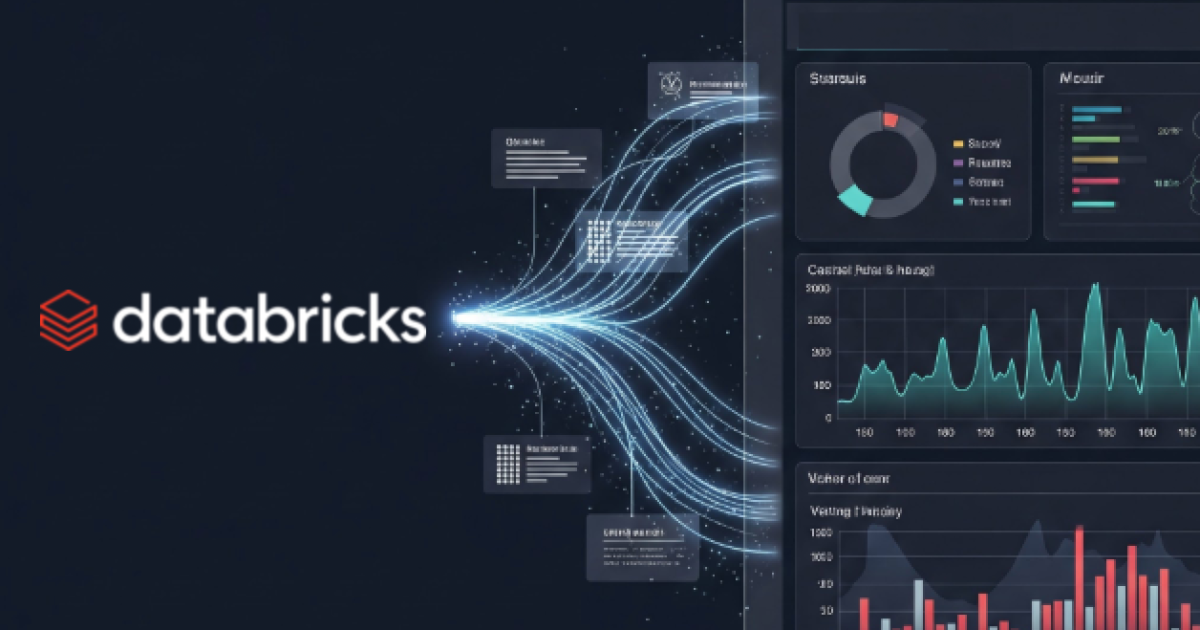
"In the world of big data, Databricks is a mission-critical platform. But how do you ensure your workloads are running efficiently, cost-effectively, and reliably? The Databricks Integration from New Relic delivers total visibility for your entire Databricks estate, allowing you to troubleshoot, optimize, and connect performance directly to cost-all from a single, unified observability platform. This integration is designed to give you immediate, actionable insight into your Databricks performance, health, and consumption."
"Unified View: See Spark applications, Lakeflow jobs, and infrastructure telemetry in one place, allowing you to quickly spot bottlenecks. Contextual Visibility: Understand how your Databricks performance impacts, and is impacted by, your broader application and infrastructure ecosystem. Pinpoint Issues: Use detailed metrics like stage duration, task I/O, and job termination codes to pinpoint the exact root cause of slow or failing jobs."
New Relic Databricks Integration delivers total visibility across Databricks estates by collecting comprehensive telemetry for performance, health, and consumption. The integration aggregates Spark applications, Lakehouse jobs, and infrastructure telemetry into a unified view to speed troubleshooting and pinpoint root causes using metrics like stage duration, task I/O, and job termination codes. Deep performance data supports Spark optimization, executor memory tuning, and RDD storage analysis to improve resource utilization. The open-source project translates telemetry into business value by connecting performance to cost, enabling efficient scaling, reduced spend, and improved reliability across Databricks workloads.
Read at New Relic
Unable to calculate read time
Collection
[
|
...
]