Silicon Valley real estate
fromSan Jose Spotlight
1 week agoSilicon Valley buyers need $1M+ salaries for homes in priciest cities - San Jose Spotlight
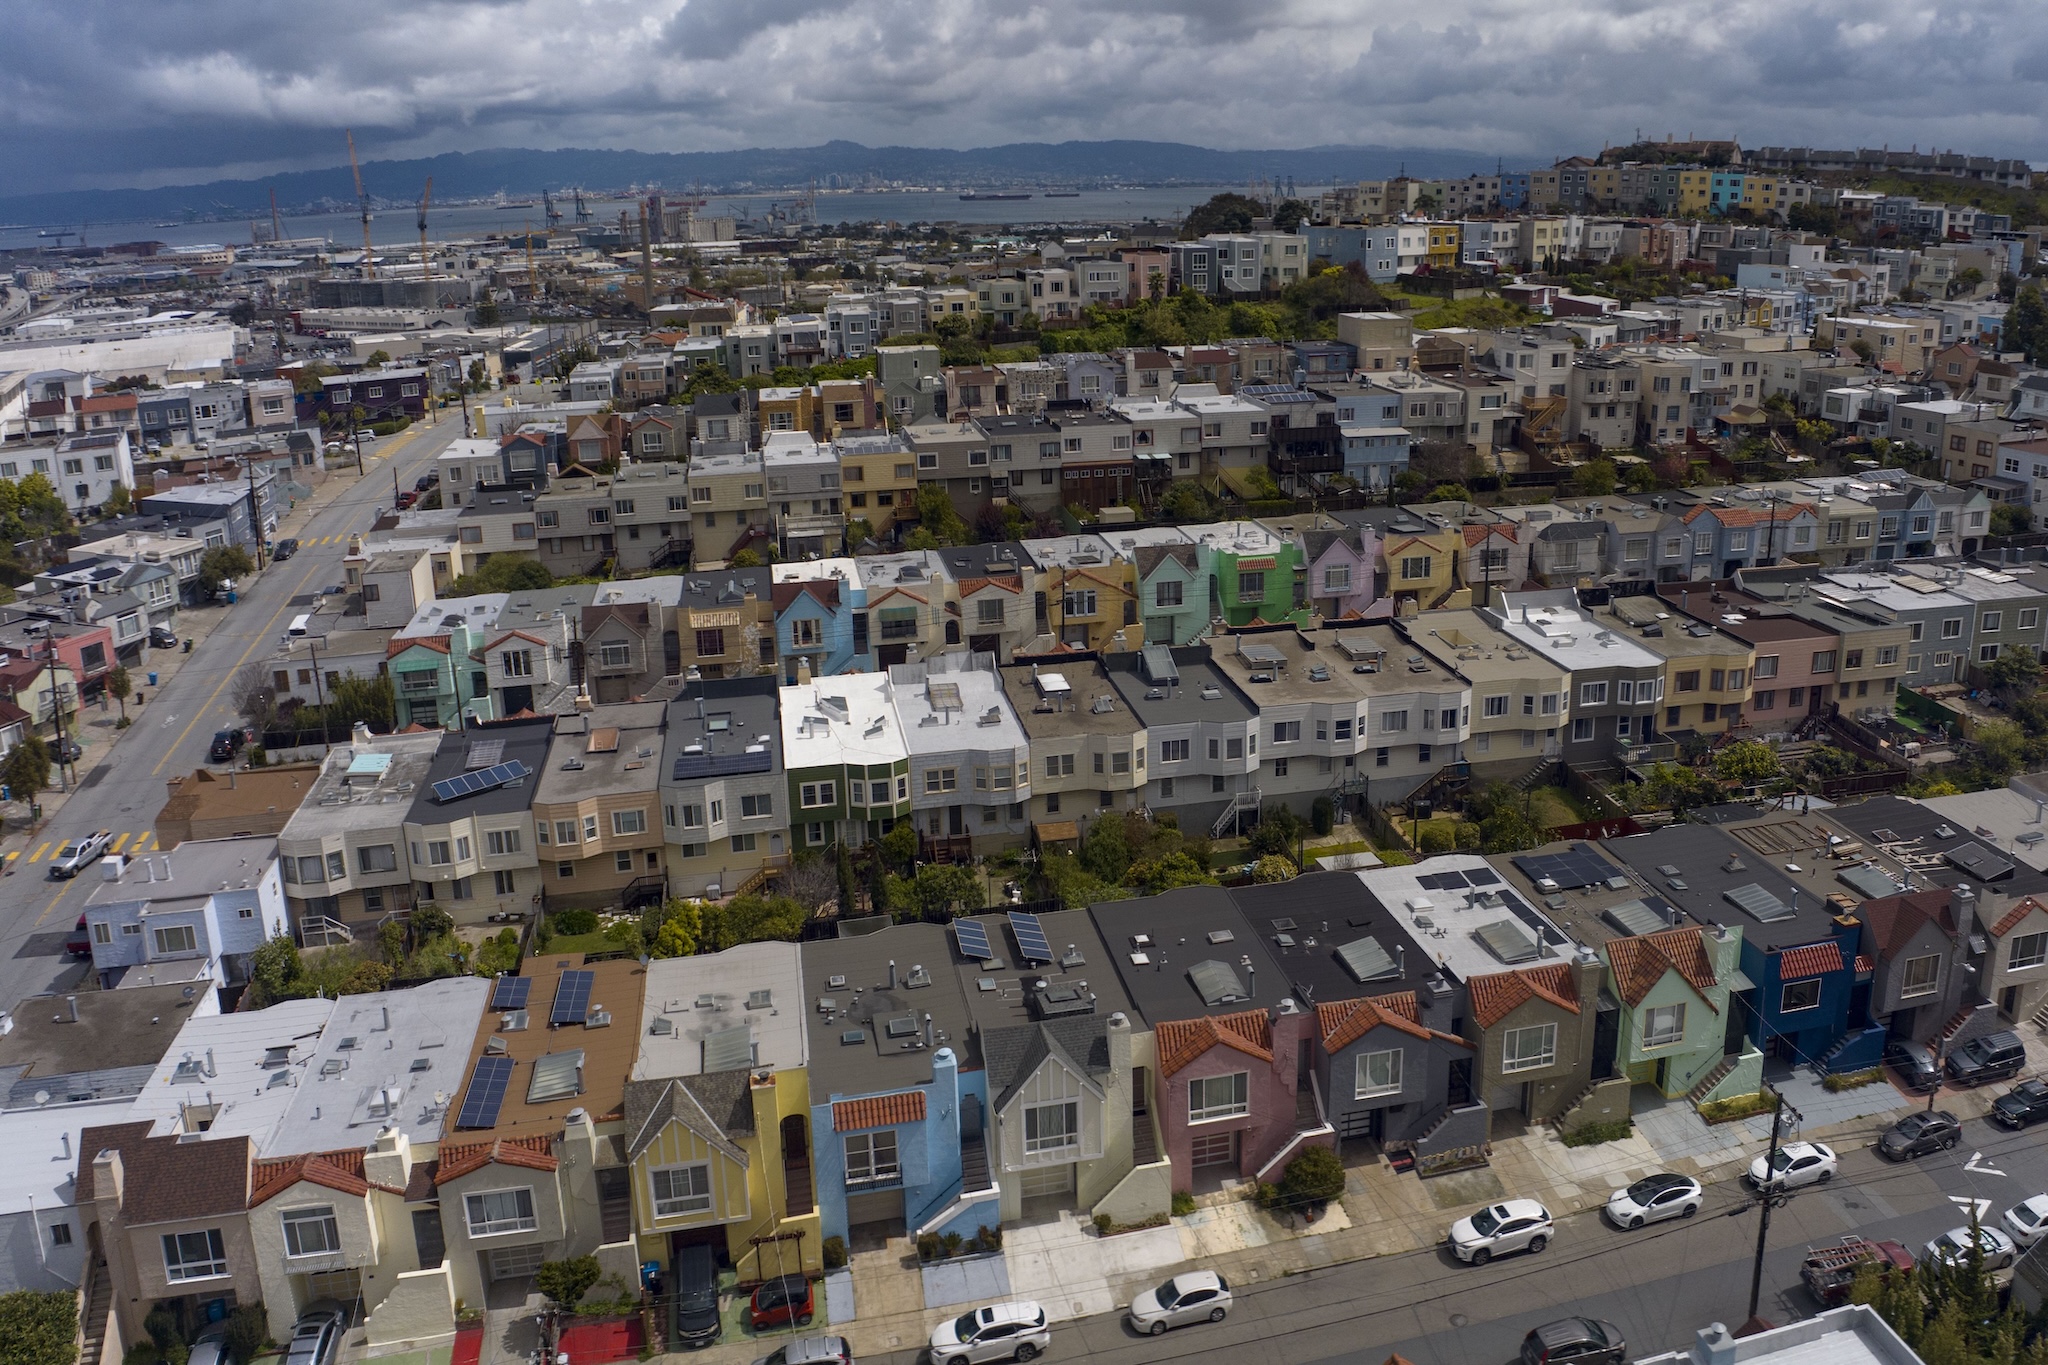
Households in the San Jose metro area need over $500,000 annually to afford a typical home, making it the most expensive housing market in the U.S.